1. Key Challenges in Australian Agriculture

  • Farmland Degradation: Approximately 66% of Australia’s farmland is degraded to some extent due to issues such as acidification, soil carbon loss, erosion, compaction, salinity, and nutrient loss.
  • Low Return on Assets (ROA): Victorian farmers average a ~1.3% ROA on capital based on ABS data, whereas top-performing farm operations in the top 20% achieve a ~5% benchmark.
  • Core Goal: Increase Return on Assets while simultaneously restoring and expanding natural capital assets.

2. The Profit Equation & Key Levers

Profit in agriculture is governed by the core equation:

Profit =Production Gross  Margin – Overheads

Gross Margin =Price/unit – Cost/Unit

Four Levers to Increase Profitability:

  1. Increase Production (Yield): Growing additional biomass/pasture or total output per hectare.
  2. Increase Price per Unit: Challenging for commodity producers who operate primarily as price takers.
  3. Decrease Cost per Unit: A primary operational lever focused on reducing the cost required to produce each unit of output.
  4. Reduce Overheads: Optimizing fixed operating expenses across the business.

3. Understanding Capital in Farming

Definition of Capital: Any asset that generates value without being consumed in the production process (e.g., a tractor vs. diesel fuel).

The 6 Forms of Capital:

  1. Financial Capital: Cash balances, working capital, and overall liquidity.
  2. Physical Capital: Infrastructure, plant, machinery, sheds, and fencing assets.
  3. Human Capital: Workforce skill levels, labor management, and human capability.
  4. Intellectual Capital: Systems, software, livestock genetics, brand equity, and operational know-how.
  5. Social Capital: Community relationships, professional networks, and local reputation.
  6. Natural Capital: Living and non-living ecosystem components, representing approximately 80% of total farm asset value.

4. Natural Capital & The Four Ecosystem Processes

Investing in Natural Capital directly enhances farm profitability and long-term asset value.

The 4 Ecosystem Processes:

  1. Mineral Cycling: Soil biological activity unlocking parent material minerals and fixing nitrogen naturally.
  2. Energy Flow: Photosynthetic capture of solar energy transferring carbon and carbohydrates to root zones and soil biology.
  3. Water Cycle: Maximizing infiltration rates, building soil water retention capacity, and improving effective moisture storage.
  4. Community Dynamics: Biodiversity and beneficial ecological interactions suppressing pest populations below economic thresholds.

The Financial Impact of Natural Capital:

  • Research covering 230,000+ hectares indicates that higher Natural Capital increases farm profit by $50–$150 per hectare.
  • Farms with high Natural Capital outperform regional financial averages by ~30%.
  • Three Financial Pathways:
    1. Boosts overall farm production and biomass yield.
    2. Reduces dependence on expensive external inputs and lowers unit production costs.
    3. Stabilizes ROA and cash flow across variable seasonal conditions.

5. Transitioning to a Biological Supply Model

  • Output Formula: Farm Output = Natural Capital Value + External Inputs
  • Core Principle: Build up Natural Capital first to facilitate input reductions over time. Avoid abruptly cutting synthetic inputs without first establishing biological capacity, as doing so impacts yields.
  • Compounding Capital: Similar to financial compounding, Natural Capital accumulates when allowed to regenerate and feed soil biology through plant root exudates.

6. The ROOTS Framework

A structured transition process to enhance input efficiency and reduce synthetic reliance:

  • R – Reframe: Shift mindsets around capital allocation, synthetic inputs, and soil biological health.
  • O – Optimize: Maximize the efficiency of current inputs (e.g., targeted soil testing, split nitrogen applications with humic acid, flexible rotational grazing matched to pasture growth rates).
  • O – Outsource: Substitute harsh synthetic inputs with biological alternatives (e.g., nitrogen-fixing microbes, humic/fulvic acids, biological inoculants, foliar amino acids).
  • T – Transform: Redesign systems for long-term ecological resilience (e.g., multi-species pastures, pasture cropping, tree shelterbelts, sub-weekly paddock rotations).
  • S – Stewardship: Continuous learning, on-farm trials, ultra-high density grazing tests, and active peer knowledge networks.

7. The Biological Buildup & Maintain Model

Can external inputs be eliminated entirely?
No—harvesting livestock, crops, or hay extracts nutrients off the property (e.g., harvesting 6 tonnes of hay/ha removes substantial potassium and phosphorus).

The Model Components:

  1. Maintain (Nutrient Removal Replacement):
    • Replace exported nutrients based on removal rates (e.g., ~3.1 kg P/ha per 445 kg liveweight sold) to preserve baseline Natural Capital.
  2. Biological Buildup:
    • Rather than relying solely on synthetic fertilizer to reach target availability, leverage photosynthesis and root exudates to stimulate phosphate-solubilizing bacteria and microbes to release bound soil mineral reserves.
    • Import specific trace elements (e.g., Copper) only when baseline parent material geology is deficient.
Soil and Tissue Testing

The Strategic Management Cycle

  1. Analysis (Identify Problems): The core step to discover root bottlenecks and limiting factors preventing you from achieving your production and financial goals.
  2. Strategy (Allocate Resources): Directs physical, financial, and operational resources to address identified problems. Good strategy focuses resources effectively; bad strategy misallocates them.
  3. Implementation (Execute Tasks): Operational execution of the defined strategic plan on-farm.
  4. Optimise (Assess & Refine): Evaluates performance and operational results to refine practices before moving on to the next operational bottleneck.


Law of Minimums & Diminishing Returns

  • Core Operational Objective: To increase Return on Assets (ROA) and build natural capital, primary production (photosynthesis) must increase. Input decisions must target maximum return per dollar spent.
  • Law of Minimums: Biological yield and crop growth are dictated by the scarcest essential resource (the limiting factor), regardless of the abundance of other nutrients.
  • Law of Diminishing Returns: Successively increasing a single variable input while keeping other factors constant eventually yields smaller incremental increases in output.
  • Practical Application: The largest economic and biological returns are achieved by accurately pinpointing and solving the primary limiting factor.


Plant Nutrition & Diagnostic Framework

  • Mineral Equality Principle: All essential plant nutrients (C, H, O, N, K, P, Ca, Mg, S, Fe, Zn, Mn, Cu, Co, B, Mo, Na, Cl, Ni, Se) are equally important. A deficiency in a trace element like Molybdenum restricts yield just as severely as Nitrogen.
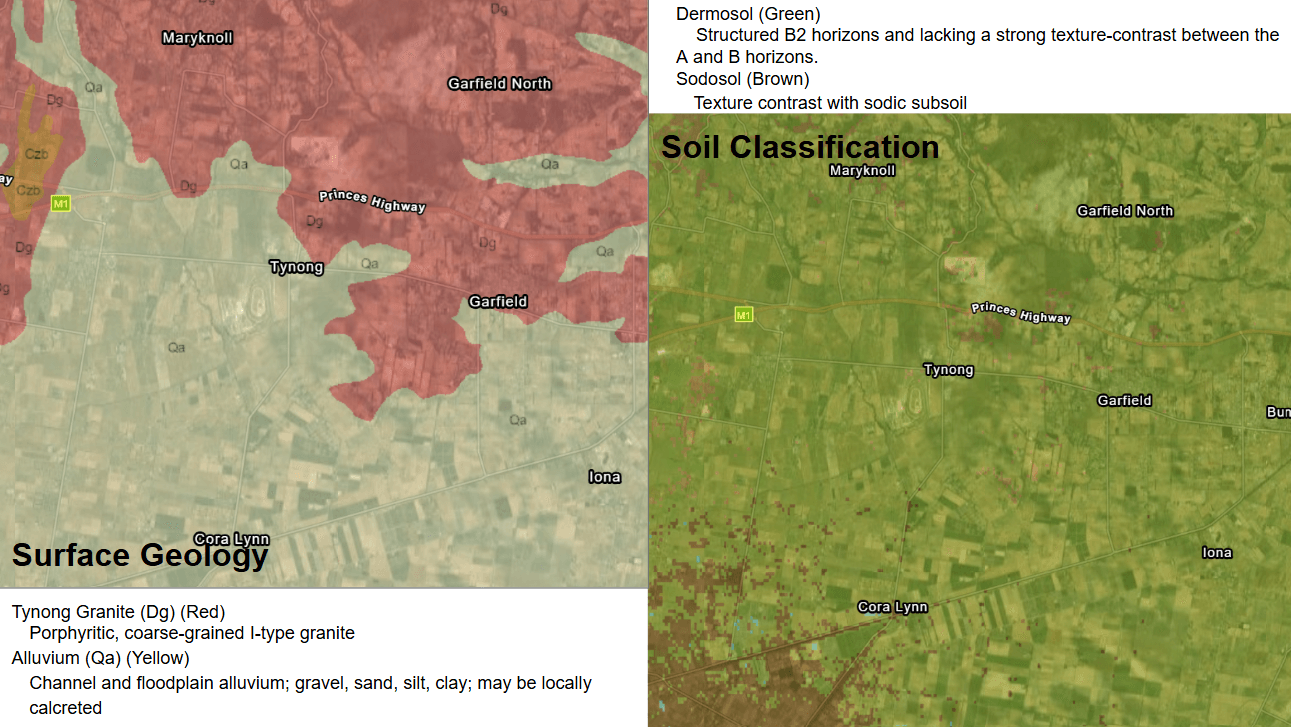
  • Geological Foundation: Parent geology dictates baseline soil texture, mineral reserve capacity, and pH limits.
  • 4-Step Diagnostic Sequence:
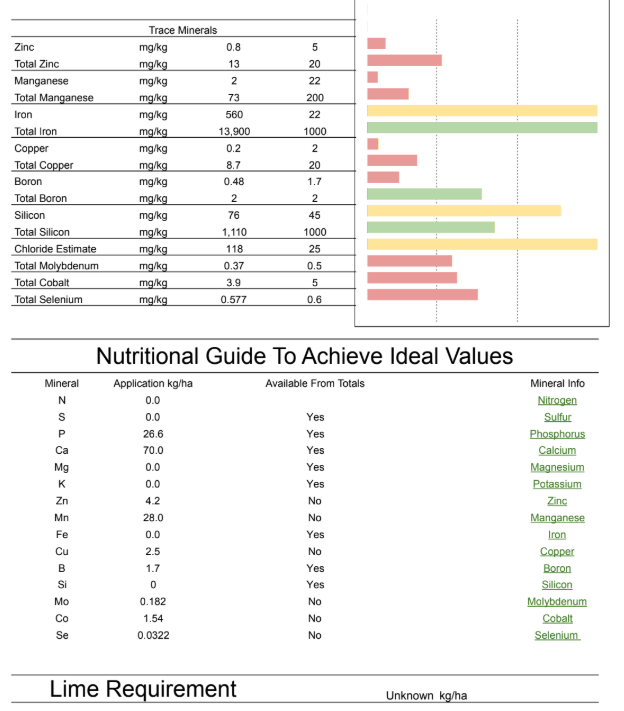
    • Step 1: Geology Mapping: Map underlying rock types using GeoScience portals (“Geological Units by Lithology” layer).
    • Step 2: Total Soil Test: Strong acid extraction revealing 80–90% of total parent mineral reserves.
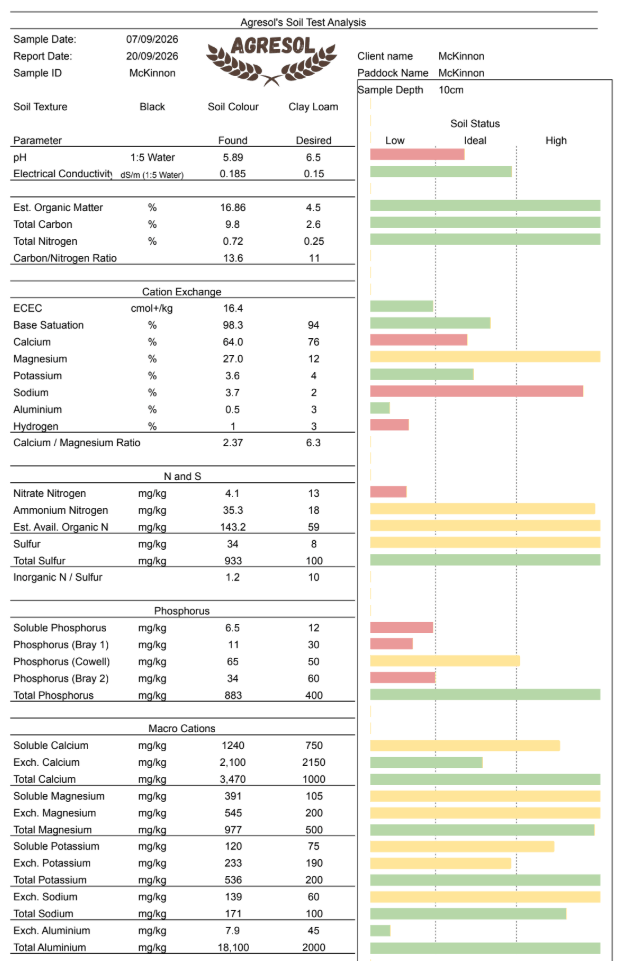
    • Step 3: Available Soil Test: Measures soluble minerals released via weathering and soil microbial activity.
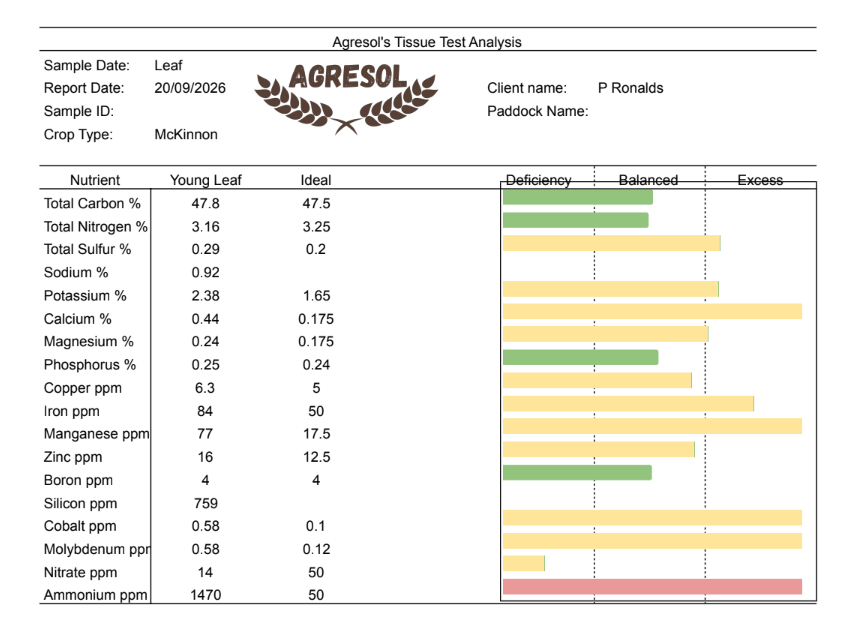
    • Step 4: Sap / Tissue Test: Assesses active mineral absorption and real-time plant uptake.

Nutritional Inputs & Application Strategy

Input Determination

  • Removal Rates: Replacing nutrients exported off-farm via harvest or livestock output to protect soil capital reserves.
  • Critical Values: Establishing target tissue/soil levels required for 90% of potential production capacity.

Core Strategies & Placement

Strategy

Primary Objective

Placement Method & Application Focus

Capital Strategy

Multi-year strategic applications to build baseline total and available soil mineral reserves.

Soil Application: Primary method for large-volume capital treatments; liquid soil applications ensure uniform trace mineral delivery.

Maintenance Strategy

Routine replacement of exported nutrients to sustain current baseline production.

Soil Application: Directly replaces nutrient export off-farm to protect long-term natural soil capital.

Response Strategy

Short-term, targeted applications engineered for immediate yield responses.

Foliar Application: Optimal for targeted response applications aligned with specific crop growth stages and limiting factors.


  • Core Methodology: Combine biological enhancement with targeted capital applications to systematically reach target thresholds.

Sap vs. Tissue vs. Differential Testing

Diagnostic Tool

Measurement Focus

Operational Value & Timing

Sap Testing

Liquid concentration within vascular plant sap.

Real-time visibility into active nutrient transport and immediate plant availability.

Tissue Testing

Whole leaf concentration in dried tissue reserves.

Measures historical accumulated uptake; can show delayed diagnostic signals.

Differential Testing

Comparative analysis between young and old leaves.

Tracks nutrient mobility and active translocation patterns across plant tissue.

Soil Constraints & Management

  • Defining Constraints: Any physical, chemical, or biological limitation restricting farm productivity and ROA.
  • Feasibility & Economic Thresholds: Interventions must be economically justified; fixing every constraint is not always viable or profitable.
  • Primary vs. Secondary Constraints:
    • Primary Constraints: Inherent natural limitations (geology, climate, hydrology) managed via strategic tactics rather than permanent fixes.
    • Secondary Constraints: Management-induced issues (bare ground, soil erosion, salinity).
  • Intervention Pathways:
    • Product Fixes: Direct input amendments (e.g., lime application for soil acidity).
    • System Fixes: Systemic operational adjustments (e.g., selecting sodic-tolerant crops like barley over wheat).
    • No Fix: Deliberate choice when correction costs exceed expected economic returns.
  • Key Diagnostic Indicators: pH, Electrical Conductivity (EC), Oxidation-Reduction Potential (ORP), sodicity, compaction, soil structure, mineral deficiencies, base saturation ratios (Ca:Mg).